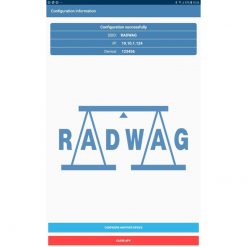

Aplikasi R-Lab
The basic function of the R.Barcode software is presentation of data sent by barcode scanners connected to a PC via USB or RS232
Butuh asisten untuk membantu Anda memilih solusi aplikasi yang paling optimal?
Hubungi ahli kami sekarang
Deskripsi
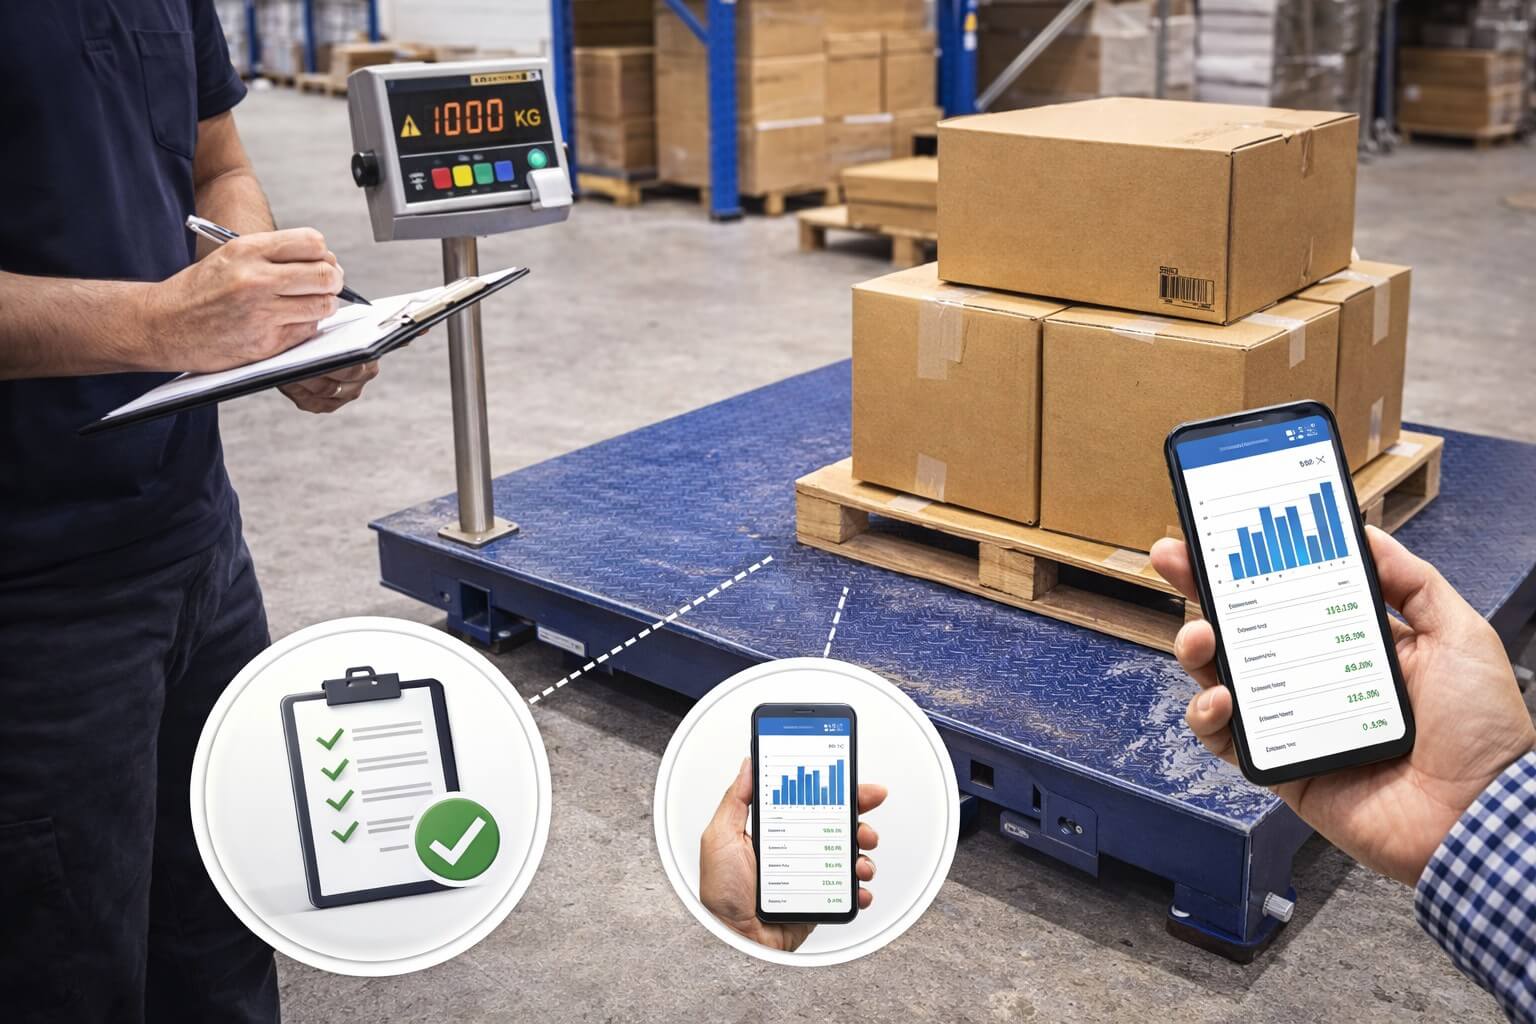
Collected information is presented on reports in a form of complex tables, and via graphs.
Graph types:
- Measurement graph with statistics data
- Gaussian distribution function (probability distribution) and a histogram
- Stability graph – difference between successive measurements
- All in one graph
The software makes it possible to generate a report for a particular series of measurements and it offers various filtering options, i.e. filtering by date, mass, unit, description or list of selected devices. R-Lab also presents reports from an ongoing session and a current day.
Statistics created by the software include measurement quantity, minimum and maximum values, mean values, median, standard and mean deviation, variance, variance and deviation estimator and weighings sum.
The data can be exported to PDF, HTML, MHT, RTF, XLS, XLSC, CSV, text and graphic files.
PRODUK TERKAIT
Berikut adalah beberapa aplikasi lain yang mungkin sesuai dengan kebutuhan Anda.